
Ben Clements
University of Leicester
May 2012
The status of the Church of England as the established church is rarely a leading item of political debate, nor does it represent a ‘bread-and-butter’ issue for members of the public. However, questions tapping into this issue are episodically asked in public opinion polls and there are often interesting differences of view between social groups. Debate on the Church of England’s constitutional status has also been stirred by the intervention of the Archbishop of Canterbury or another high-profile bishop in a salient matter of public policy. In December 2008, in an interview with the Times newspaper, the Archbishop of Canterbury said that he recognised the case for disestablishment and that, if it were to occur, it would not be ‘the end of the world’.
To shed further light on public attitudes on the question, and to highlight some of the social and political dividing lines, this post uses data from the British Election Study (BES) AV Referendum Study, undertaken in spring 2011. This study consists of pre- and post-campaign waves (total sample size is 18,856). The question on disestablishment was asked on the post-campaign wave. The question asked was: ‘The Church of England should keep its status as the official established church in England.’ The response options were: ‘strongly agree’, ‘agree’, ‘neither agree nor disagree’, ‘disagree’ and ‘strongly disagree’. This question was included as part of a battery of items probing respondents’ views on various reforms which could be made to Britain governing arrangements.
Note that in all tables shown here, ‘strongly agree’ and ‘agree’ responses, and ‘disagree’ and ‘strongly disagree’ responses, have been combined into broader agree and disagree categories. The tables below exhibit responses broken down by four socio-demographic characteristics (gender, ethnic group, age group and region) and three attitudinal measures (political party supported, left-right ideology, and newspaper readership). Unfortunately, data is not available for religious affiliation or attendance at religious services. The data are weighted to provide a representative sample. Please click on each table to enlarge.
Table 1 shows the breakdown of responses to this question. A majority (54 per cent) agrees with the status quo, with just over a fifth (22 per cent) holding a neutral view. Just 16 per cent are opposed to the status quo (the remainder are not sure). Few cannot offer an opinion (just 8 per cent).

Source: BES AV Referendum Survey Data.
Table 2 shows responses broken down by gender. Women are slightly more likely than men to support the status quo (57 compared to 50 per cent), with men more likely to disagree (19 compared to 12 per cent). In each case over a quarter has a neutral viewpoint.

Next, Table 3 shows responses divided by ethnic background (white, Asian, black, or other). There are similar levels of support for the status quo amongst white and black respondents (54 and 55 per cent, respectively). There is less support amongst Asian respondents, with only 40 per cent favouring the status quo. However, support for disestablishment is not higher amongst Asian respondents compared to white respondents; they are more likely to hold a neutral viewpoint than the other ethnic groups. Both white and Asian respondents (15-16 per cent) are twice as likely to oppose the status quo as are black respondents (just 8 per cent). Those of other ethnic backgrounds are most likely to disagree (at 18 per cent) but more likely than Asian respondents to agree (46 per cent).

Table 4 provides responses divided into age groups. We might plausibly expect older age groups to be more supportive of the status quo: the evidence in Table 4 tends to support this. Those aged 18-24 years are much less likely to support the status quo than are those aged 65 and over (41 and 62 per cent, respectively). There is a steady increase in support for the status quo across age groups. There is not such a clear disparity, however, in the proportions who disagree with the status quo. For example, while 19 per cent of 18-24 years olds are in favour of disestablishment, this only decreases to 14 and 13 per cent, respectively, amongst those aged 55-64 years and 65 or over. ‘Don’t know’ responses are much more common amongst the two youngest age groups. There are similar levels of neutral responses across age groups.

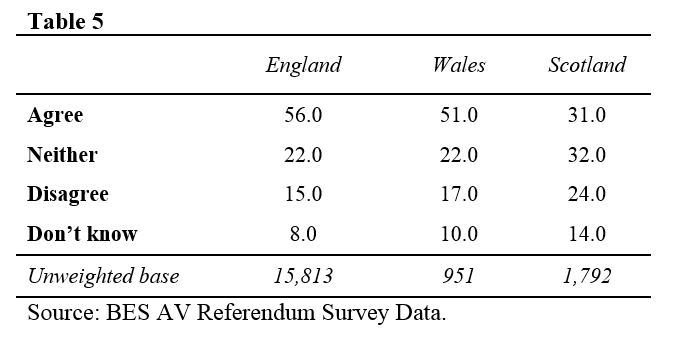
The final socio-demographic characteristic is the region where a respondent lives, shown in Table 5. Given the socio-geographic make-up of Britain’s religious fabric, we would expect differences of opinion. Table 5 supports this. Respondents who live in England and Wales are much more likely to support the status quo (over half in each case) than are those who reside in Scotland (just 31 per cent). Those living in Scotland are more likely to opt for a neutral response (32 per cent) or to oppose the status quo (24 per cent). Interestingly there is a higher proportion of ‘don’t knows’ amongst those living in Scotland.
Next, Table 6 gives responses according the political party a respondent supports (Labour, Conservative, Liberal Democrat, other party, does not support any party). Befitting the historical associations between the Church of England and the Conservative party, the latter’s partisans are much more likely to support the status quo (nearly 70 per cent). Less than half of Labour and Lib Dem supporters are in favour of retaining the status quo, though there is least support among those who do not support any party. Just over half of those supporting some other party are in favour of the current set-up, though this category comprises a heterogeneous grouping of party loyalists (including those supporting the Green Party, Scottish and Welsh nationalist parties, UKIP and the BNP).

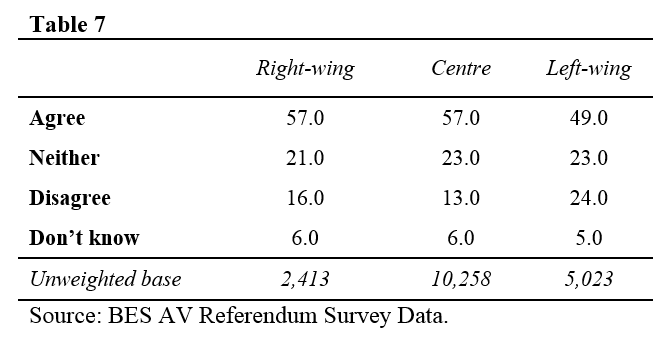
Table 7 shows attitudes towards disestablishment according to ideological viewpoint. It uses a question asking about preferences on taxation and expenditure as a ‘proxy’ measure of left-right ideological beliefs. Those who prefer higher spending and taxation are classified as ‘left-wing’, those who prefer lower taxation and reduced expenditure are designated as ‘right-wing’, while those who fall in between are classified as the ‘centre’. There is clearly greater support for the status quo amongst those in the right or centre (57 per cent), while left-wing respondents are less likely to support the current set-up (49 per cent) and more likely to favour disestablishment (24 per cent). Across categories, similar proportions have a neutral opinion.
Finally, Table 8 provides views on the question divided by the newspaper read by respondents (either every day or sometimes). Rather than listing every possible title covered in the survey, it provides a selection of results for some of the main national dailies (four tabloids and four broadsheets). Support for the status quo is highest amongst readers of the Daily Mail, Express, Telegraph and Sun. Around half of those who read the Mirror or the Times support the current set-up. There is least support amongst readers of the Guardian and Independent. Respectively, 45 and 34 per cent of Guardian and Independent readers are in favour of disestablishment. Of course, readers of these two broadsheet papers will also tend to hold more left-leaning views on a range of policy issues, including other aspects of constitutional reform.

The findings reported here can be looked at in conjunction with previous BRIN posts which have analysed attitudes towards the disestablishment question and related issues: http://www.brin.ac.uk/2011/monarchical-religion/. The dataset and questionnaires used here can be obtained from http://bes2009-10.org/.
Ben Clements, Department of Politics, University of Leicester. For further correspondence, contact bc101@leicester.ac.uk.
Pingback: What Anglicans (and others) think about homosexuality and disestablishment | British Religion in Numbers