
The breakdown of the census religion counts by age and sex, released 30 January 2023, helps us to picture the religious landscape in the decades ahead. The obvious change is well known, though perhaps not yet fully grasped: the proportion of the population that is Christian is being squeezed from two directions. People of Christian heritage increasingly say that they have no religion, and at the same time, Islam and other minority religions have a growing share.
The graph below shows the percentage of people in the Christian and no religion categories by age, according to the 2021 census in England and Wales. The two lines are in nearly mirror image: Christian losses are mostly gains to no religion. Parents answer the census questions for their children, and as many are not inclined to ascribe a religious affiliation to infants or young children, the Christian line starts very low. By about age 10 children are described as Christian with roughly the same frequency as their parents (who are around age 40). Teenagers start to demonstrate their independence, and so we see a hump in the reported affiliation of children. The Christian share hovers around 30 percent for adults now in their 20s and rises steadily across older generations, approaching (though not quite reaching) 80 percent in the earliest cohorts. Conversely, more than half of people in their 20s have no religion, while among the elderly not quite one in ten are unaffiliated.

The picture for the three largest religious minorities – Muslims, Hindus and Sikhs – is interestingly different. Children are assigned to a religion immediately. Muslims constitute more than 10 percent of every year of age through 18, though the proportion falls rapidly thereafter. There is an additional bulge in the 30s and early 40s, however, which might be the result of refugee inflows or spousal migration in the past decade or two.
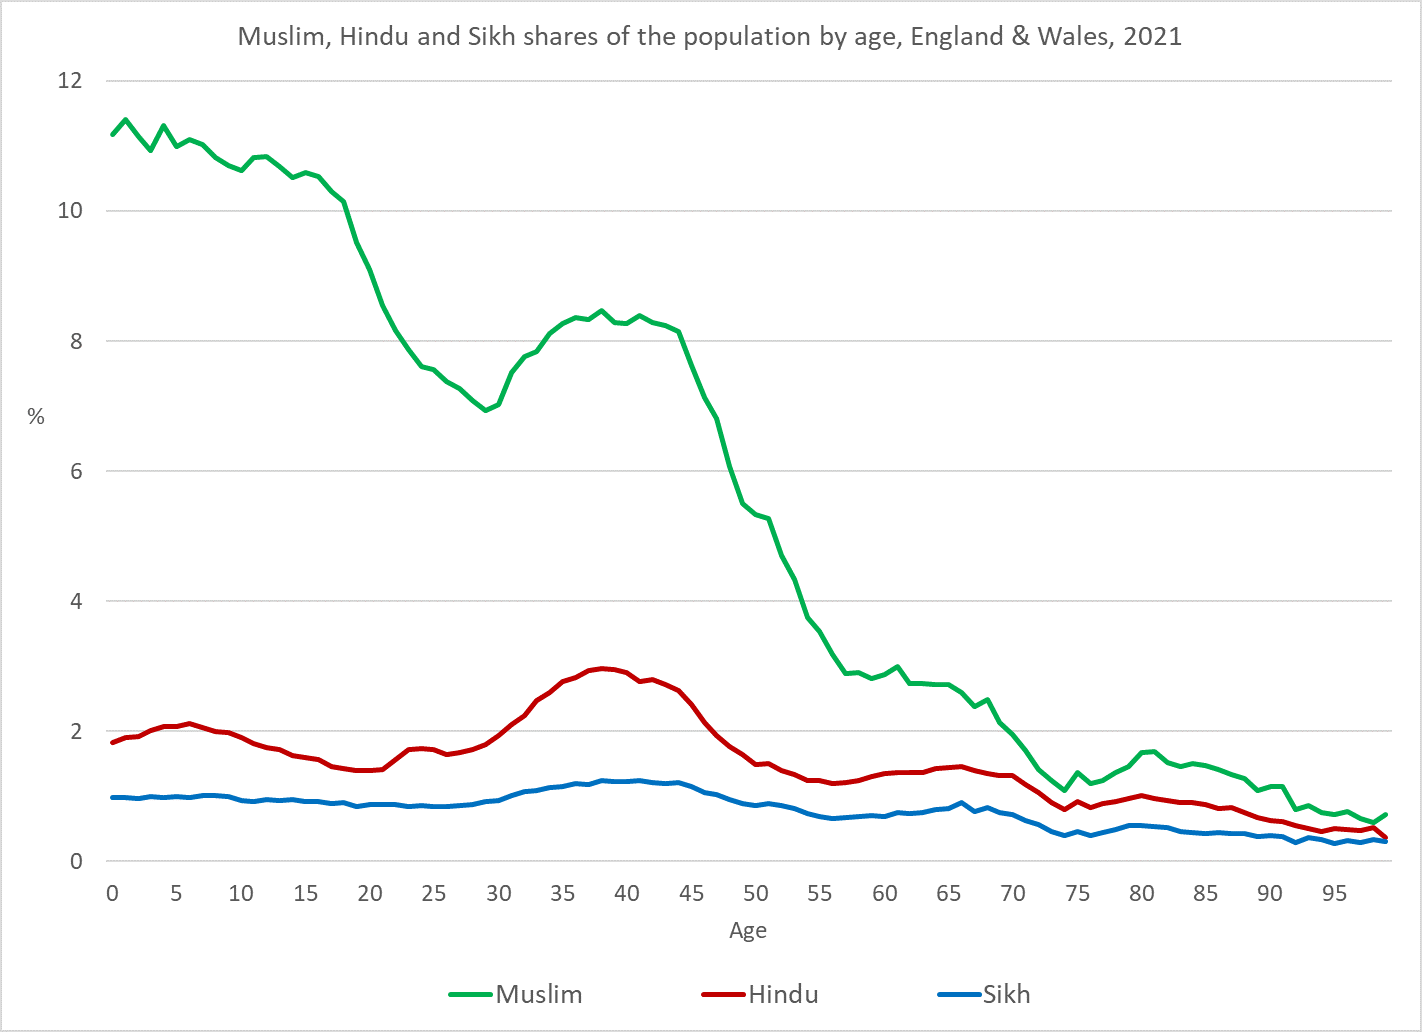
It is simple to predict that within a few decades, at least one in six people in England and Wales will belong to a non-Christian religion, even in the absence of further immigration. Muslims will be 11%, Hindus 2%, Sikhs 1%, and other groups (including Buddhists and Jews) a further 2%. In practice migration will continue to boost both Christian and non-Christian numbers. At some point it is likely that some people of non-Christian heritage will say that they have no religion, but for the moment these ethno-religious labels are a persistent component of social identity.
In a previous post, I noted that many people who ticked the Christian box in the 2011 census chose ‘No religion’ ten years later. We can learn more by looking at the no religion shares of the Christian-heritage population (estimated by summing the Christian, no religion and religion not stated categories) in 2011 and 2021. The graph below is focused on people aged 25 and older, who are generally living independently and have reasonably settled identities. Census respondents aged 25+ in 2011 were 35+ in 2021, and we can compare their responses in the two censuses.
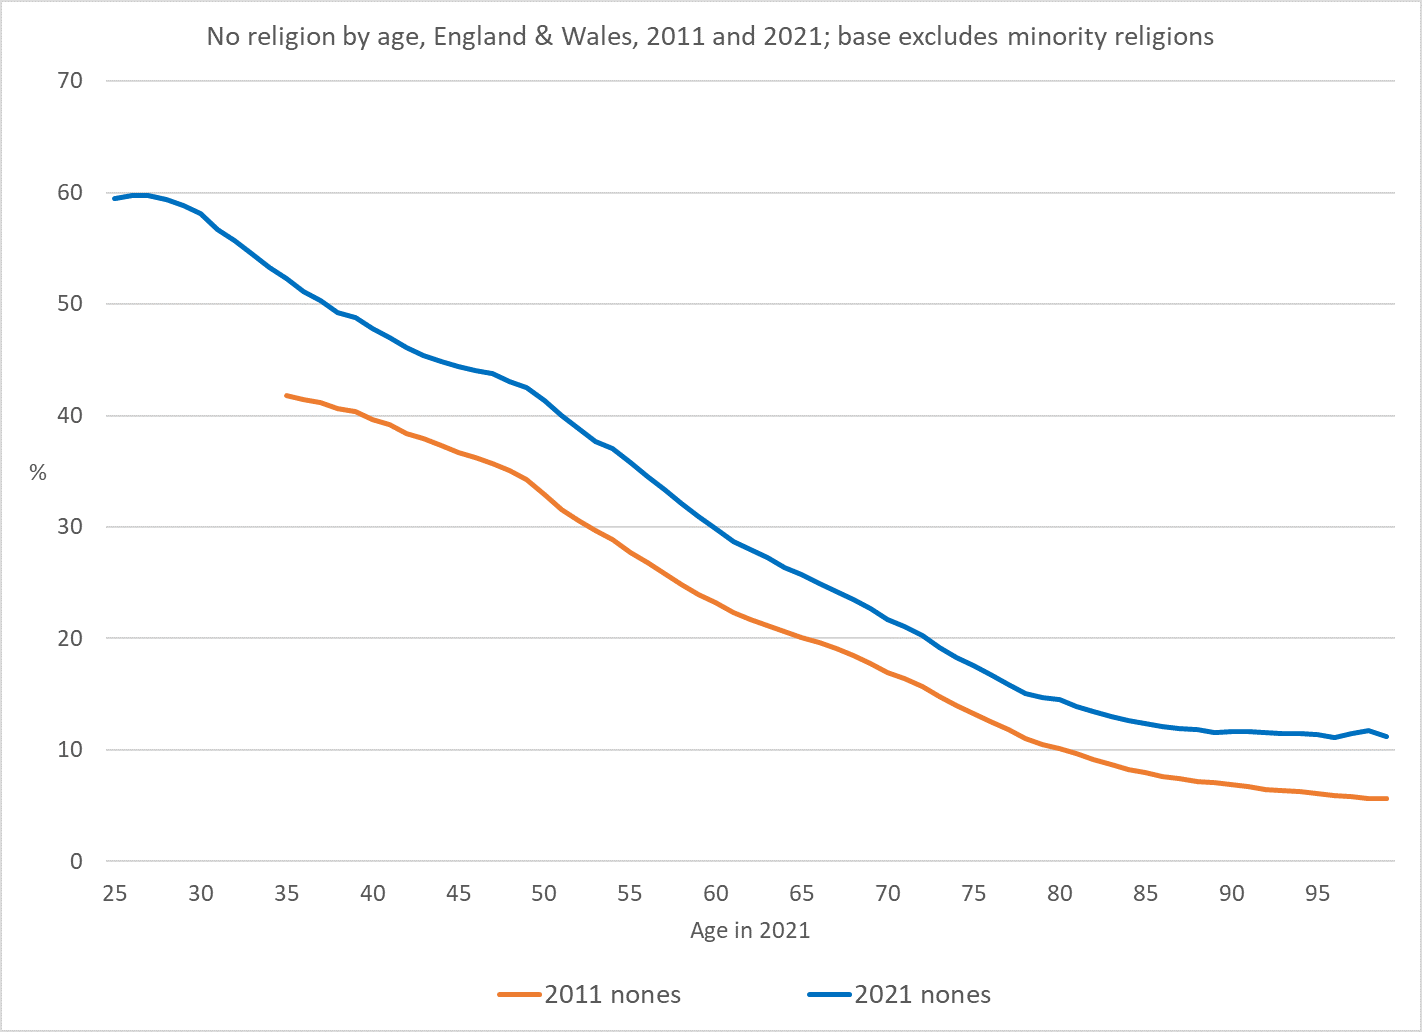
The shift towards no religion is distributed remarkably evenly across all years of age. It is slightly more pronounced among younger cohorts, but the intercensal gap is relatively constant. As Sir Bernard Silverman pointed out in his comment on my post last week (and as I mentioned in a BRIN post ten years ago about the 2011 results), however, this comparison almost certainly underestimates the amount of individual switching that occurred. Net migration to the UK has added at least two million people over the past decade, most of whom will have a religious identity. The additional Christians will have depressed the ‘no religion’ proportions shown above for 2021. If the new arrivals were disproportionately young adults, the drift from Christian to no religion in those birth cohorts will be more pronounced than implied by this graph. More precision will have to wait until further data from the census become available.
2 Responses to A less Christian future for England and Wales