
This post looks at how religious groups voted in the June 2017 general election. As with previous BRIN posts on this topic, it uses data from the British Election Study. Specifically, it uses the 2017 post-election wave (number 13) of the British Election Study Internet Panel 2014-18. The fieldwork was conducted by YouGov between 9-23 June 2017. The survey has a sample size of 31,196. Theset data and accompanying documentation were obtained from the BES website. The data were weighted and analysed on a cross-sectional basis.
Figure 1 presents the breakdown of the vote at the June general election based on religious affiliation. It shows the proportions voting Conservative, Labour, or for other parties combined. The traditional support of Anglicans for the Conservative Party is reaffirmed (58% voted for the Tories compared to 28% for Labour). The distribution of the vote amongst Catholics further highlights the declining support they have given to Labour at recent general elections, given their historical tendency to vote for that party. In 2017, 42% of the Catholic vote went to Labour, just ahead of the 40% that went to the Conservative Party.
Amongst Methodists, Baptists and those who identified as Church of Scotland, pluralities supported the Conservative Party. Amongst other Christians, support for Labour eclipsed that for the Conservatives (42% versus 38%).
Muslims voted overwhelmingly for Labour, with 85% having preferred for Jeremy Corbyn’s party, and 11% supported the Conservatives. Majorities, albeit somewhat reduced, voted Labour at the 2005-2015 general elections. Amongst Jews, a strong majority expressed support for the Conservative Party (63%), with around a quarter (26%) saying they voted for Labour. This builds on the plurality support for the Conservative Party shown by Jewish voters at the 2005-2015 general elections. Labour also received a plurality of the vote amongst those belonging to other religions (48%) and those with no religious affiliation (47%). Amongst these two groups, the Conservative vote share was, respectively, 33% and 32%.
Figure 1 Voting at the 2017 general election by religious affiliation

Source: Author’s analysis of British Election Study Internet Panel 2014-2018, wave 13.
Putting the recent voting behaviour of Anglicans and Catholics in long-term perspective, Figure 2 and Figure 3 show the party vote shares amongst, respectively, Anglicans and Catholics between 1959 and 2017 (based on data from BES studies). Figure 2 shows the tendency of Anglicans to have expressed greater support for the Conservative Party at most post-war general elections.
Figure 2 Voting at general elections by Anglicans, 1959-2017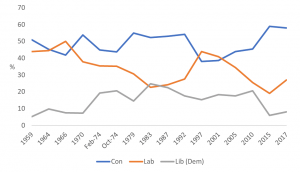 Source: Author’s analysis of BES surveys.
Figure 3 shows the traditionally strong party-denominational links between the Catholic community and Labour. The higher levels of support amongst Catholics for Labour compared to the Conservatives (the exception is the 1979 election) are apparent, but support amongst has declined at recent elections. Support for the Conservatives has correspondingly increased at those elections.
Figure 3 Voting at general elections by Catholics, 1959-2017

Source: Author’s analysis of BES surveys.
Based on data from the BES and – where available – Scottish General Election Studies, Figure 4 shows that support for Labour has traditionally been considerably higher amongst Catholics in Scotland compared to those in England. However, in 2015, a ‘sea change’ general election in Scotland, there was a substantial drop in support for Labour amongst Catholics in Scotland. For the first time, in 2015, support for Labour amongst Catholics in England was slightly higher than that recorded in Scotland, and this was also the case in the 2017 general election (43% in England and 35% in Scotland). Though support for Labour was declining amongst Catholics in Scotland in the years prior to the 2015 election.
Figure 4 Vote share for Labour amongst Catholics in England and Scotland, 1970-2017

Source: Author’s analysis of BES and SGES surveys.
Reference
Fieldhouse, E., J. Green., G. Evans., H. Schmitt, C. van der Eijk, J. Mellon and C. Prosser (2017) British Election Study Internet Panel Wave 13. DOI: 10.15127/1.293723.
Pingback: Beware cherry-picked stats on Labour and antisemitism | SRI LANKA
Pingback: Labour’s performance in the top 10 Jewish constituencies – PoliticalSift
Pingback: Are Muslims fleeing Labour? « Kapil's Khichadi